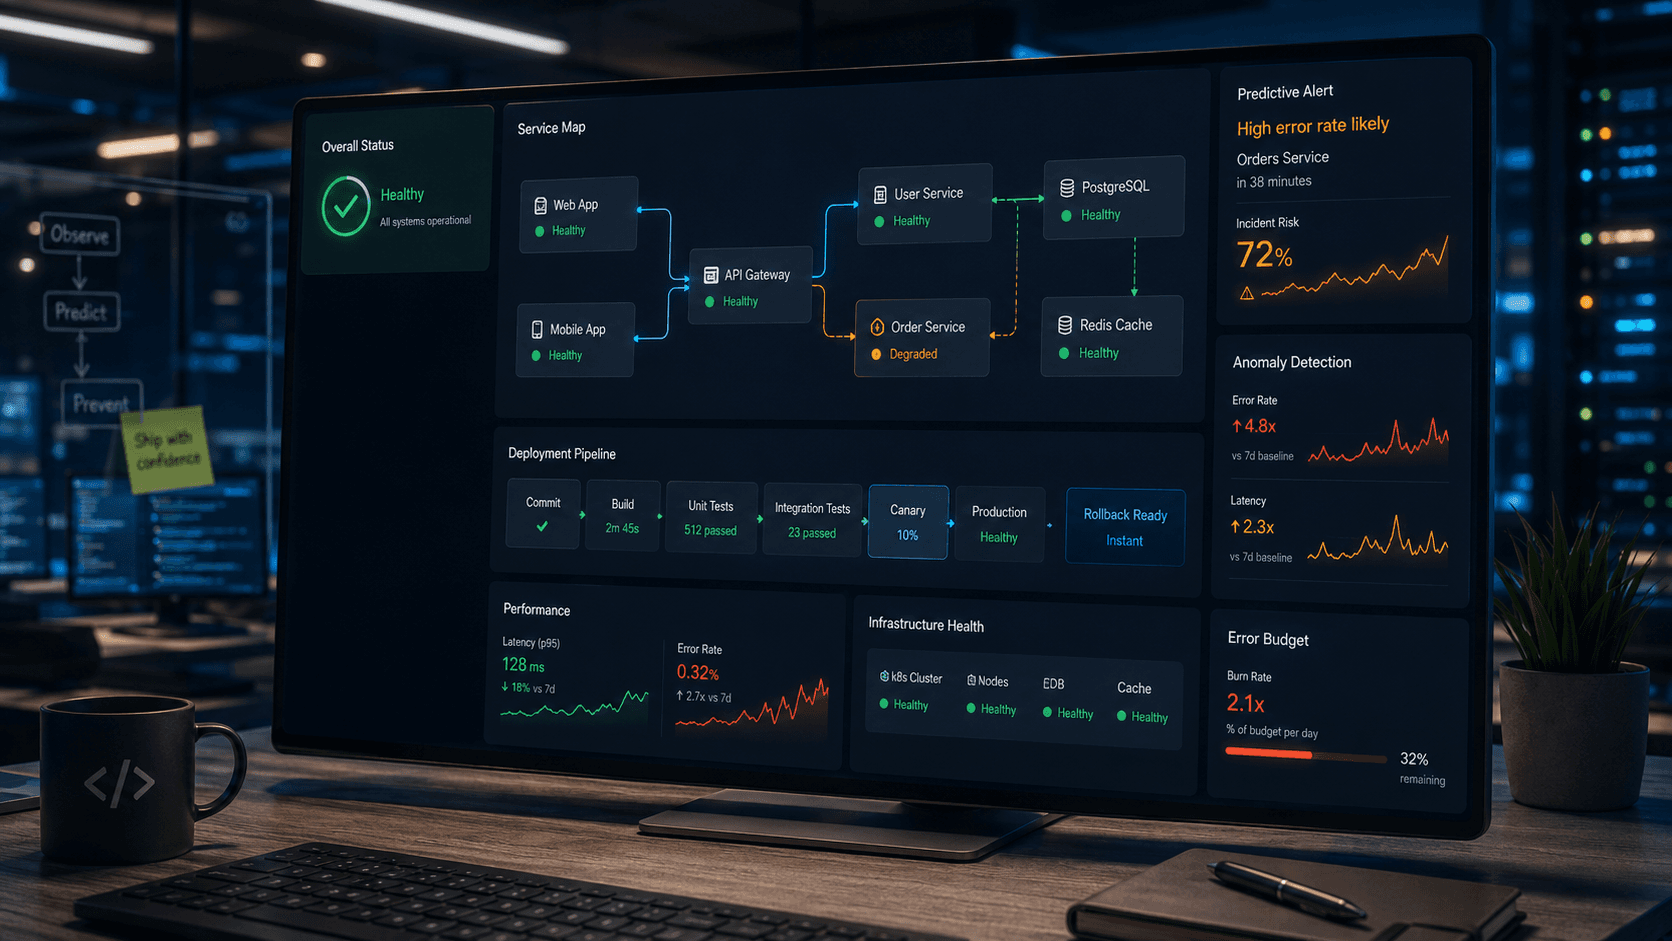
The dashboard is green. All systems report operational. Yet, the support tickets are piling up, users are complaining about slow responses, and that uneasy feeling in your gut tells you something is deeply wrong.
This is the classic dilemma of relying solely on uptime monitoring. A server might be running, but the application itself could be crawling, encountering silent errors, or heading towards a complete meltdown.
The Illusion of Uptime: Why 'Green' Isn't Enough
For too long, our industry has focused on simple 'is it up?' checks. These are essential, of course; a down server is undeniably a problem.
However, modern web applications and AI-assisted workflows are complex, distributed systems. They fail in subtle, interconnected ways that a simple ping or port check will never reveal.
We've seen countless instances where the core infrastructure was technically 'up,' but critical business functions were failing. This could be a database query taking 30 seconds, a third-party API intermittently timing out, or an internal microservice struggling under an unexpected load.
Observability: Gaining X-Ray Vision into Your Systems
This is where true observability comes into play. It’s a paradigm shift from merely monitoring known failure points to understanding the internal state of a system from its external outputs.
It’s about asking arbitrary questions of your system, not just predefined ones. At Muhyo Tech, we view observability as a proactive engineering discipline, baked into the design process.
We aim to understand not just if something broke, but why it broke and, critically, when it might break again.
The Pillars of Proactive Engineering: Logs, Metrics, and Traces
A robust observability strategy typically stands on three foundational pillars, each offering a unique lens into system behavior.
1. Logs: The Storyteller of Events
Logs are the detailed narrative of what happened within your application. They record events, errors, warnings, and informational messages.
The key here isn't just generating logs, but making them structured, searchable, and enriched with contextual data like correlation IDs. This allows us to trace a user request across multiple services, even if an error occurs deep within the stack.
Without structured, consistent logging, debugging becomes a frantic, time-consuming grep hunt through unreadable text files.
2. Metrics: The Pulse of Performance
Metrics are quantifiable measurements of your system's performance and health over time. Think CPU utilization, memory consumption, network I/O, and crucially, application-specific metrics.
These custom metrics might include the number of successful API calls, average response times for specific endpoints, queue sizes for background jobs, or even business-critical counts like new user registrations.
By tracking trends and setting intelligent alerts on these metrics, we can detect performance degradations long before they become critical failures. This allows us to spot a slow database query or an overloaded service hours before users notice.
3. Traces: Following the Request's Journey
In a distributed architecture, a single user request might traverse multiple microservices, databases, and third-party APIs. Tracing allows us to visualize this entire journey.
Each operation within the request path is recorded, showing its duration and dependencies. This makes it incredibly easy to pinpoint bottlenecks, identify latency spikes, and understand the ripple effects of a single slow service.
Without distributed tracing, diagnosing performance issues in a complex web application can feel like trying to solve a puzzle with half the pieces missing.
From Reactive Firefighting to Predictive Maintenance
Implementing a comprehensive observability strategy transforms how we approach system reliability and maintenance.
Instead of waiting for a complete outage, we can leverage trends in metrics to predict scaling needs or impending resource exhaustion. Anomalies in logs can trigger alerts about unusual application behavior that might signal an attack or a creeping bug.
This proactive stance means we often address issues during off-peak hours, preventing user impact entirely. For businesses, this translates directly to stronger reliability, less downtime, and a better user experience.
Our Approach to Building Resilient Systems
At Muhyo Tech, integrating observability isn't an afterthought; it's a fundamental aspect of our engineering philosophy.
When we design modern websites, web applications, or AI-assisted workflows, we embed instrumentation from the very beginning. This includes thoughtful logging practices, defining key performance indicators (KPIs) as custom metrics, and implementing distributed tracing where appropriate.
We believe that an observable system is a scalable system. It empowers our clients with clear insights into their digital services, reducing maintenance risk and enabling confident growth.
The Tradeoffs: An Investment, Not a Free Lunch
It's important to acknowledge that building robust observability isn't without its challenges or costs. There's an initial investment in tooling, configuration, and developer training.
The sheer volume of data generated by logs, metrics, and traces can be substantial, leading to increased storage and processing costs. We must also carefully consider data retention policies and privacy implications.
However, the cost of an unexpected outage – in terms of lost revenue, damaged reputation, and frantic emergency fixes – almost always dwarfs the investment in proper observability. It’s a strategic choice for long-term stability.
The Business Value: Confidence in Every Launch
Ultimately, engineering for observability delivers tangible business value. It means faster launches because you can confidently monitor new features in production.
It leads to fewer bugs making it to production and a quicker resolution when they do. This translates to better customer trust, a smoother user experience, and a stronger foundation for long-term scalability.
When systems are truly observable, founders and business owners gain peace of mind, knowing their digital services are not just 'up,' but genuinely healthy and performant.
Conclusion: Seeing Beyond the Surface
Moving beyond basic uptime monitoring to a full observability practice is no longer a luxury; it's a necessity for any serious digital service.
It transforms our ability to diagnose, predict, and ultimately prevent production issues, ensuring that your web applications and AI workflows remain reliable and high-performing. This engineering discipline is how we build digital products that not only work but thrive under pressure.