


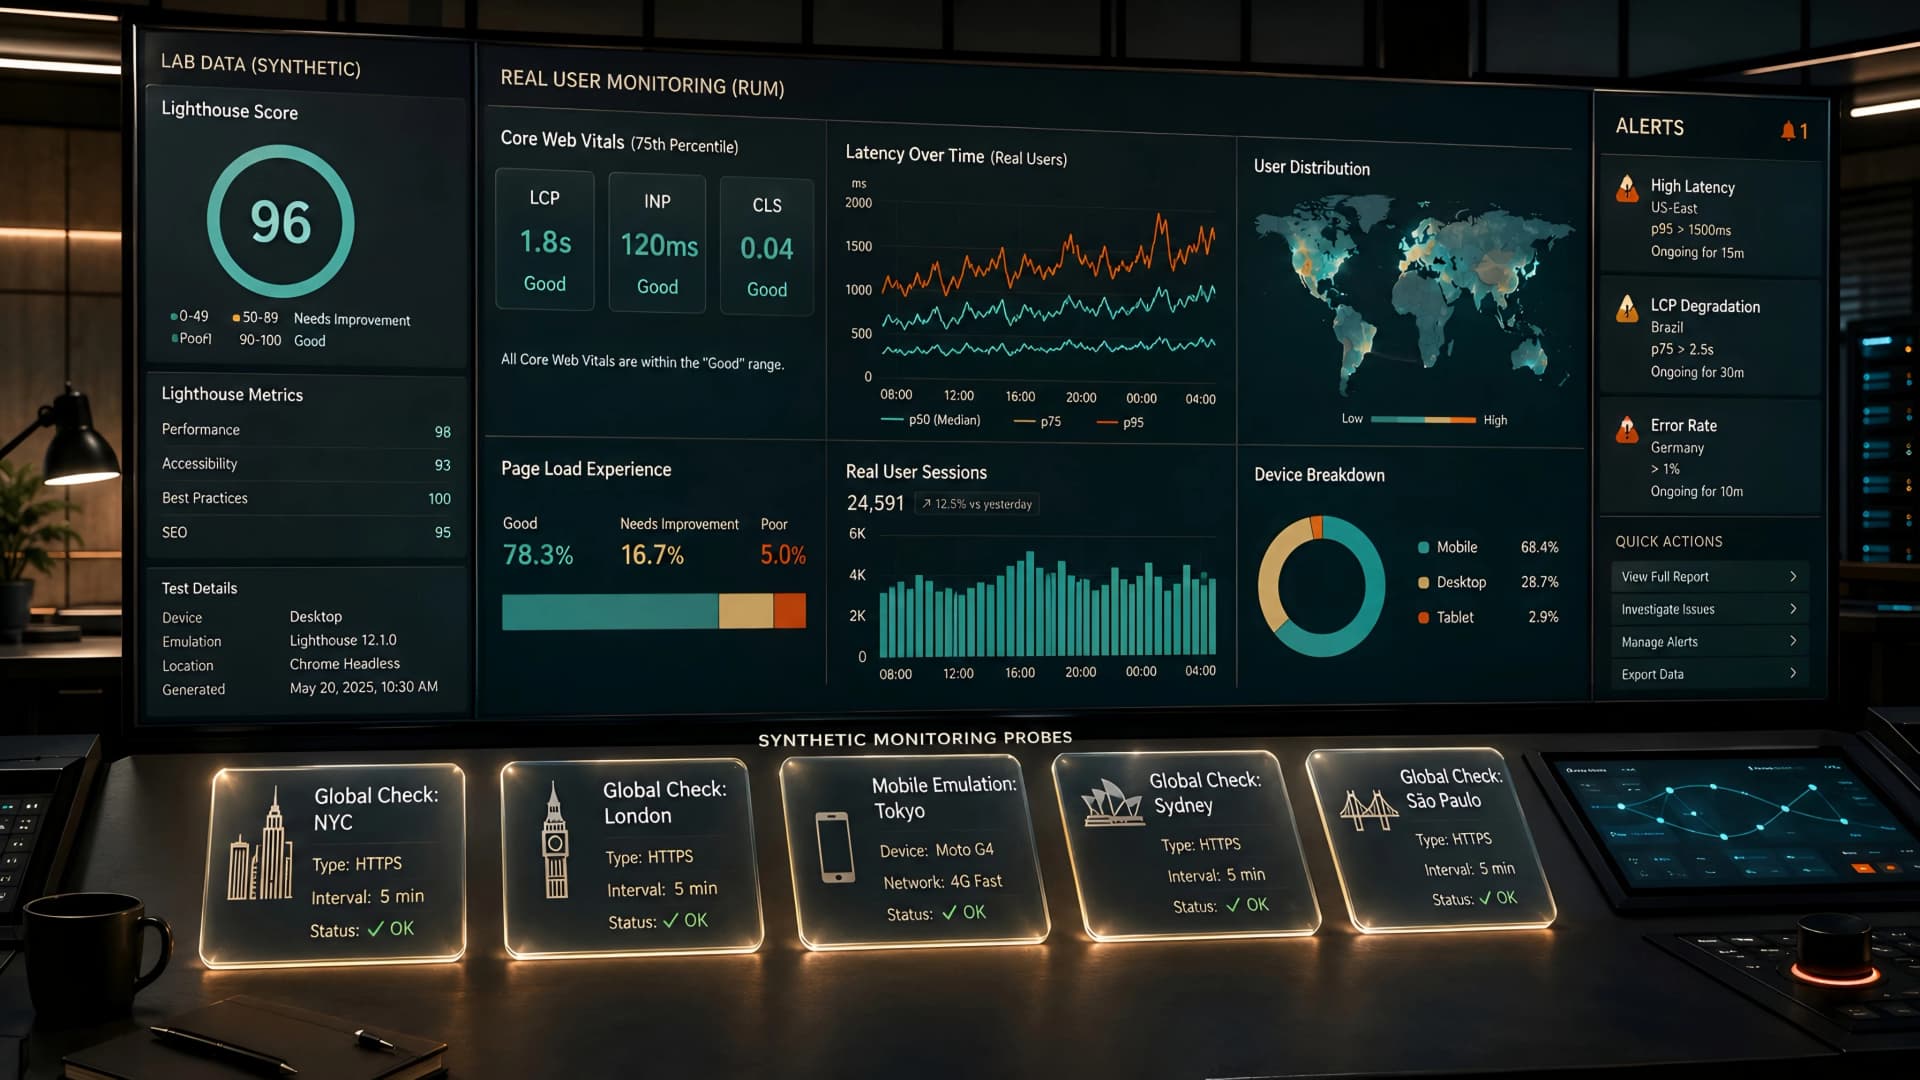
When we talk about web performance, the conversation often begins with Lighthouse scores. It's a great tool, offering a quick, synthetic snapshot of how a page *might* perform under ideal conditions.
But here's the uncomfortable truth: a high Lighthouse score doesn't always translate to a fast, frustration-free experience for every single one of your users. Their network conditions, device capabilities, and geographic location vary wildly.
The Limits of Lab Data: Why Lighthouse Isn't Enough
Lighthouse and similar lab-based tools run in a controlled environment. They simulate a typical user device and network, giving you a consistent, reproducible benchmark.
This consistency is invaluable for development and identifying foundational performance issues. However, it's a simulation, not reality.
A perfect Lighthouse score on your development machine means little if your actual users are on an older mobile phone, on a shaky public Wi-Fi connection, halfway across the globe. Their experience, the one that truly impacts your business, remains a mystery.
At Muhyo Tech, we emphasize that lab data is a starting point, not the finish line. True performance optimization requires understanding the messy, unpredictable reality of how people interact with your site.
This is where Real User Monitoring (RUM) and sophisticated Synthetic Monitoring become indispensable tools in an engineer's arsenal. They bridge the gap between idealized lab conditions and the diverse experiences of your actual audience.
What is Real User Monitoring (RUM)?
Real User Monitoring, or RUM, involves collecting performance data directly from your users' browsers as they interact with your website. It captures metrics like page load times, resource loading, navigation timings, and Core Web Vitals (CWV) from actual user sessions.
Think of it as having millions of tiny sensors in your users' browsers, sending back anonymous data about their experience. This data provides an unfiltered view of how your site performs in the wild.
Key Benefits of RUM
- True User Experience: RUM shows you what your actual users are experiencing, accounting for their unique devices, networks, and locations.
- Identify Geographic Bottlenecks: Pinpoint performance issues specific to certain regions or ISPs.
- Prioritize Optimizations: Focus on the pages and user segments experiencing the most pain, where improvements will have the greatest business impact.
- Track Core Web Vitals: Directly measure Google's critical user experience metrics across your entire audience.
- Understand Impact of Releases: Immediately see how new deployments affect real user performance.
Common RUM Metrics
- First Contentful Paint (FCP): When the first content element is painted to the screen.
- Largest Contentful Paint (LCP): When the largest content element becomes visible.
- Cumulative Layout Shift (CLS): Measures unexpected layout shifts.
- First Input Delay (FID) / Interaction to Next Paint (INP): Measures responsiveness to user interaction.
- Time to First Byte (TTFB): The time it takes for the browser to receive the first byte of the response.
- DOM Content Loaded (DCL): When the initial HTML document has been completely loaded and parsed.
- Page Load Time: The total time it takes for a page to fully load.
- Error Rates: Client-side JavaScript errors.
What is Synthetic Monitoring?
Synthetic monitoring involves using automated scripts or bots to simulate user interactions with your website from various locations and network conditions. These tests run on a predefined schedule, providing consistent, reproducible performance data.
Unlike RUM, synthetic monitoring doesn't rely on actual user traffic. It's like having a robot user constantly checking your site's pulse from different vantage points around the world.
Key Benefits of Synthetic Monitoring
- Proactive Issue Detection: Identify performance regressions or outages before real users report them.
- Baseline Performance: Establish a consistent baseline for performance metrics, unaffected by real user variability.
- Competitive Benchmarking: Monitor competitor performance from a neutral perspective.
- Controlled Testing: Simulate specific user journeys (e.g., login, checkout) to test critical paths.
- Pre-Production Testing: Use it to test staging environments before a release.
Types of Synthetic Tests
- Uptime Monitoring: Simple checks to ensure a page or API endpoint is accessible.
- Page Load Tests: Measure full page load times, individual resource timings, and waterfall charts from various locations.
- Transaction Monitoring: Automate multi-step user flows (e.g., adding to cart, submitting a form) to ensure critical business processes are working.
RUM vs. Synthetic Monitoring: A Synergistic Approach
It's not a question of RUM *or* Synthetic, but RUM *and* Synthetic. They offer complementary perspectives, and together they provide a holistic view of your application's performance and availability.
Think of Synthetic monitoring as your early warning system and RUM as your detailed diagnostic tool for real-world impact.
Comparison Table: RUM vs. Synthetic
| Feature | Real User Monitoring (RUM) | Synthetic Monitoring |
|---|---|---|
| Data Source | Actual user browsers | Automated scripts/bots |
| Coverage | All users, all traffic | Predefined paths, scheduled intervals |
| Context | Real-world network, device, location | Controlled, simulated environments |
| Detection | Identifies real user pain, post-release issues | Proactive, pre-release issue detection |
| Cost Driver | Volume of traffic/data | Number of tests, locations, frequency |
| Best For | Understanding true UX, prioritizing fixes | Uptime, baseline, critical path validation |
| Data Granularity | High variability, aggregated insights | Consistent, detailed waterfall data |
Implementing RUM: A Practical Guide
Integrating RUM into your web application is typically straightforward, often involving a small JavaScript snippet.
1. Choose a RUM Provider
Many excellent RUM providers exist, offering various features and pricing models. Popular choices include:
- Google Analytics (especially for Core Web Vitals via Google Search Console)
- New Relic
- Datadog
- Splunk (formerly SignalFx)
- Dynatrace
- Sentry (focus on error monitoring with performance insights)
- Lighthouse CI (for continuous integration performance checks)
2. Integrate the JavaScript Snippet
Once you've chosen a provider, you'll usually get a small JavaScript snippet to embed in your website's <head> tag. This ensures the RUM agent loads as early as possible.
<!-- Example: A RUM provider's script -->
<script>
  // RUM provider's initialization code here
</script>
3. Configure Custom Metrics and Attributes
Standard metrics are a good start, but consider adding custom attributes to enrich your data. This could include:
- User IDs (hashed/anonymized)
- A/B test variations
- Feature flag states
- Authentication status
- Subscription tiers
At Muhyo Tech, when we integrate RUM solutions, we always plan for custom attributes. They transform raw data into actionable insights, helping us correlate performance with specific user segments or application states.
4. Set Up Dashboards and Alerts
Raw RUM data is overwhelming. Create dashboards that visualize key performance indicators (KPIs) and Core Web Vitals. Set up alerts for significant drops in performance or increases in error rates.
For example, an alert could trigger if LCP for mobile users in North America exceeds 4 seconds for more than 15 minutes.
Implementing Synthetic Monitoring: Step-by-Step
Synthetic monitoring requires a bit more setup, as you're defining specific tests and user journeys.
1. Select a Synthetic Monitoring Tool
Many RUM providers also offer synthetic monitoring, allowing for a unified observability platform. Dedicated synthetic tools also exist, such as:
- Pingdom
- UptimeRobot
- Site24x7
- StatusCake
- BrowserStack (for cross-browser testing with performance)
2. Define Your Test Locations and Frequencies
Choose monitoring locations relevant to your user base. Decide how frequently tests should run (e.g., every 5 minutes, every hour).
More locations and higher frequencies mean more data, but also higher costs.
3. Create Critical User Journey Scripts
For transaction monitoring, you'll script multi-step interactions. This might involve using a browser automation tool like Selenium or Playwright, or the tool's built-in recorder.
// Example: Pseudocode for a synthetic login test
navigate_to("/login");
fill_field("#username", "testuser");
fill_field("#password", "password123");
click_button("#login-submit");
assert_text_on_page("Welcome, testuser!");
4. Set Performance Thresholds and Alerts
Define acceptable performance thresholds for your synthetic tests. If a page load takes longer than 3 seconds, or a transaction fails, trigger an alert.
These alerts are crucial for proactive incident response.
Translating Insights into Business Value
Understanding RUM and Synthetic data is only half the battle. The real value comes from using these insights to drive business outcomes.
- Improved User Retention: A faster site means less frustration, leading to users spending more time and returning more often.
- Higher Conversion Rates: Smooth, quick checkout flows or form submissions directly translate to more completed transactions and leads.
- Reduced Bounce Rates: Users are less likely to abandon a site that loads quickly and feels responsive.
- Stronger SEO Rankings: Core Web Vitals are a ranking factor. Optimizing them based on RUM data can improve search visibility.
- Lower Operational Costs: Proactive issue detection from synthetic monitoring reduces the time and resources spent on reactive firefighting.
- Better Developer Productivity: Clear performance data helps developers focus their efforts on changes that genuinely improve user experience, reducing wasted cycles.
For instance, if RUM data reveals that LCP is consistently poor for mobile users on 3G networks, we might prioritize optimizing image delivery or critical CSS for those conditions. This isn't just a technical fix; it's a direct investment in the experience of a specific, potentially high-value, user segment.
Common Pitfalls and Trade-offs
While invaluable, RUM and Synthetic monitoring aren't without their complexities and costs.
Data Overload
RUM can generate massive amounts of data. Without proper filtering, aggregation, and dashboarding, you can drown in metrics. Focus on actionable insights rather than every single data point.
Sampling and Data Accuracy
To manage costs, some RUM providers sample data, meaning they don't collect every single user session. Understand your provider's sampling strategy and its implications for data accuracy, especially for low-traffic pages.
Cost Considerations
Both RUM and Synthetic tools come with costs, often scaling with data volume, number of synthetic tests, and features. Balance your budget with the depth of insight you need.
Privacy Concerns (RUM)
Collecting real user data requires careful attention to privacy regulations (e.g., GDPR, CCPA). Ensure your RUM implementation is compliant, anonymizes sensitive data, and clearly informs users.
Maintenance of Synthetic Scripts
Synthetic transaction scripts can break with UI changes. Budget time for maintaining these scripts to ensure they remain effective and accurate.
Best Practices for a Holistic Performance Strategy
- Start with Core Web Vitals: Use them as your primary metrics for both RUM and Synthetic tests.
- Integrate into CI/CD: Use synthetic tests in your deployment pipeline to catch regressions early.
- Correlate Data: Look for patterns between RUM data (real user pain) and synthetic data (consistent failures).
- Educate Your Team: Ensure product managers, designers, and developers understand the importance of performance metrics and how to interpret them.
- Iterate and Optimize: Performance is not a one-time fix. It's a continuous process of monitoring, analyzing, optimizing, and re-monitoring.
- Focus on User Journeys: Don't just monitor page loads. Track the performance of critical user flows that impact your business goals.
Implementing a robust RUM and synthetic monitoring strategy is a core component of how Muhyo Tech approaches website speed optimization. It moves beyond theoretical performance to ensure tangible improvements for the people who actually use your products.
Frequently Asked Questions
What's the main difference between RUM and Google Search Console's Core Web Vitals report?
Google Search Console's Core Web Vitals report uses Field Data, which is essentially RUM data collected by Google Chrome. It's a great source, but a dedicated RUM tool offers far more granularity, segmentation capabilities (e.g., by device, region, user segment), and real-time insights that Google's report doesn't.
How often should synthetic tests run?
The frequency depends on the criticality of the monitored path and your budget. For critical uptime and core page loads, every 5-15 minutes is common. For less critical user journeys or expensive tests, hourly or even daily might suffice. The goal is to detect issues before they significantly impact users.
Can RUM negatively impact website performance?
Most RUM scripts are highly optimized to have a minimal impact. They are typically asynchronous and non-blocking. However, a poorly implemented RUM script or one that loads too many resources can add overhead. Always monitor the RUM script's own performance footprint.
Is it possible to track server-side performance with RUM?
RUM primarily tracks client-side (browser) performance. However, metrics like Time to First Byte (TTFB) give an indication of server response time. For deeper server-side insights, you'll need Application Performance Monitoring (APM) tools that integrate with your backend infrastructure.
Conclusion: Engineering for the Human Experience
Chasing a perfect Lighthouse score can be a satisfying engineering challenge, but it risks missing the forest for the trees. The real goal of web performance optimization is to deliver an exceptional experience to every user, every time.
By embracing a dual strategy of Real User Monitoring and Synthetic Monitoring, you gain the complete picture: the consistent, proactive checks of synthetic tests combined with the authentic, diverse insights from RUM. This powerful combination allows engineering teams to move beyond lab-based assumptions and truly optimize for the human experience.
The investment in these tools and practices pays dividends in user satisfaction, business metrics, and ultimately, the long-term success of your digital products. It's about building trust through reliability and speed, a cornerstone of our approach at Muhyo Tech.