


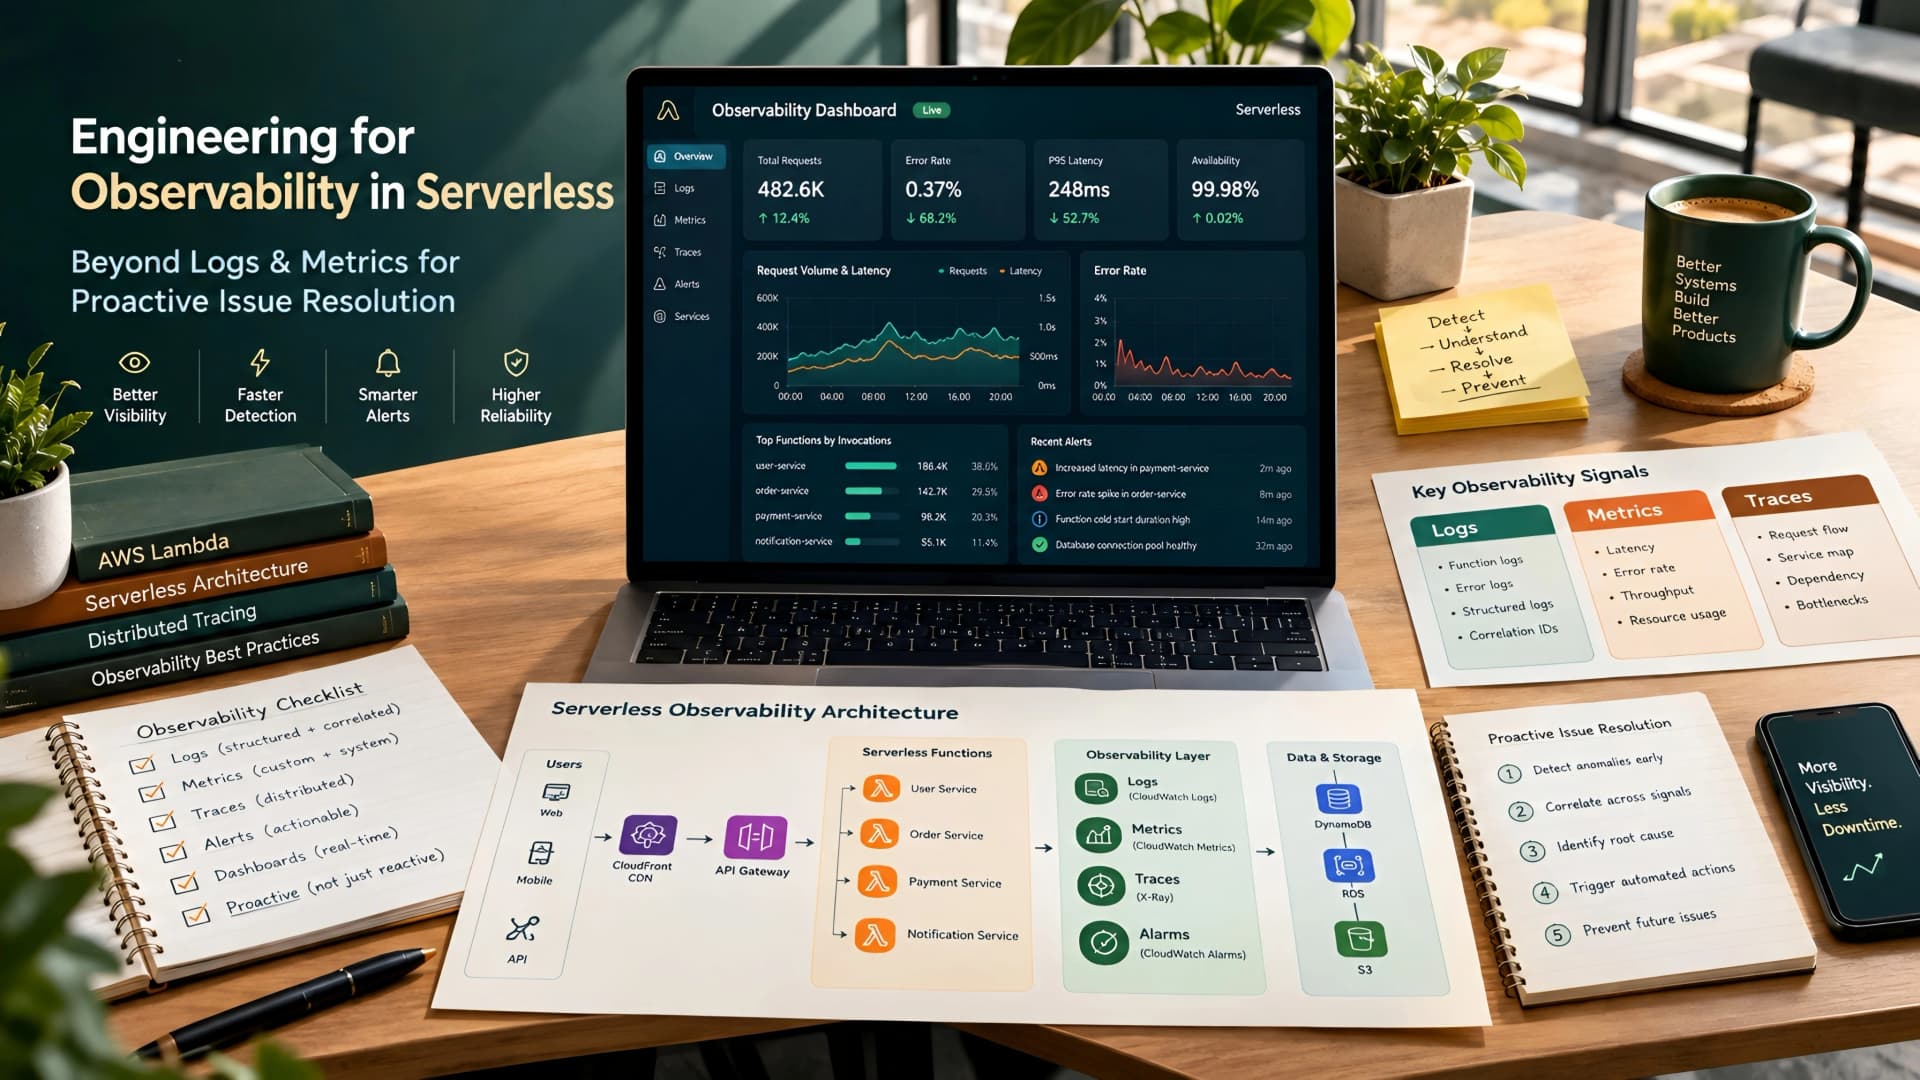
Serverless architectures promise agility and reduced operational overhead. Yet, the very benefits that make them attractive – ephemeral functions, distributed nature, and event-driven patterns – also introduce significant challenges for understanding what's actually happening when things go wrong.
Traditional monitoring, relying heavily on simple logs and basic metrics, often falls short. We need a deeper, more integrated approach to truly achieve proactive issue resolution.
The Serverless Observability Gap: Why Traditional Tools Fall Short
In a monolithic application, you might tail a single log file or monitor a few key server metrics. With serverless, your application is a constellation of independent functions, queues, databases, and APIs, each potentially residing on different compute instances and having its own lifecycle.
This distributed nature means that a single user request can trigger a cascade of events across multiple services. Pinpointing the root cause of a latency spike or an error requires more than just knowing one function failed; you need to understand the entire flow leading up to that failure.
Defining Proactive Observability in Serverless Environments
Proactive observability moves beyond merely reacting to alerts. It's about designing your systems to provide rich, contextual data that allows you to identify anomalies, predict potential failures, and understand complex interactions before they impact users.
This involves a deliberate strategy encompassing structured logging, comprehensive metrics, and, critically, distributed tracing.
Pillars of Advanced Serverless Observability
Achieving true proactive issue resolution in serverless demands a multi-faceted approach. We focus on three core pillars that, when combined, provide an unparalleled view into system behavior.
1. Structured Logging with Context
Raw, unstructured logs are notoriously difficult to parse and analyze at scale. Structured logging, where log messages are formatted as JSON or key-value pairs, makes them machine-readable and easily queryable.
Beyond just structure, adding contextual information is vital. Include details like request IDs, user IDs, function names, invocation IDs, and relevant business transaction identifiers. This allows you to trace a specific event across multiple log streams.
2. Granular Custom Metrics for Performance Insight
While platform-provided metrics (like invocation count, errors, duration) are a good starting point, they rarely tell the whole story. Custom metrics allow you to track application-specific performance indicators.
Consider tracking internal service call durations, cache hit ratios, queue depths, or even business-level metrics like successful order processing rates. These custom metrics, when properly tagged, provide critical insights into application health and user experience.
3. Distributed Tracing for End-to-End Visibility
Distributed tracing is arguably the most crucial component for serverless observability. It provides a visual representation of a request's journey through your entire distributed system, showing every service, function, and database call involved.
Each 'span' in a trace represents an operation, showing its duration, status, and any associated metadata. This allows you to quickly identify bottlenecks, cold starts, and errors within a complex transaction flow.
Implementing Distributed Tracing: Standards and Tools
For distributed tracing, adhering to open standards is key. OpenTelemetry has emerged as a vendor-neutral standard for instrumentation, providing a single set of APIs, SDKs, and data formats for generating and exporting telemetry data.
At Muhyo Tech, we often integrate OpenTelemetry agents or SDKs directly into our serverless functions. This ensures consistent trace propagation and data collection across various services, even when they're written in different languages or deployed on different serverless platforms.
Popular tools that consume OpenTelemetry data include AWS X-Ray, Datadog, New Relic, and Grafana Tempo. The choice often depends on existing cloud infrastructure, cost considerations, and specific feature requirements.
Correlating Data for Deeper Insights
The real power of proactive observability comes from correlating data across these different pillars. Your structured logs, custom metrics, and distributed traces should all be linked by common identifiers, such as a 'trace ID' or 'request ID'.
When an alert fires from a metric, you should be able to jump directly to the relevant logs and traces for that specific time window and request. This significantly reduces Mean Time To Resolution (MTTR) by eliminating time spent manually searching for clues.
Architectural Checklist for Proactive Serverless Observability
When designing or refactoring a serverless application, consider this checklist:
- Standardized Request IDs: Ensure a unique request ID is generated at the entry point and propagated through all subsequent service calls.
- OpenTelemetry Integration: Implement OpenTelemetry SDKs for all serverless functions and services.
- Contextual Log Enrichment: Automate the addition of trace IDs, span IDs, and other relevant context to all structured logs.
- Custom Metric Definition: Identify critical application-level performance indicators and instrument them with custom metrics.
- Centralized Logging: Route all logs to a centralized logging platform (e.g., CloudWatch Logs, Splunk, Elastic Stack).
- Tracing Backend: Select and configure a distributed tracing backend (e.g., AWS X-Ray, Jaeger).
- Alerting Configuration: Set up proactive alerts on key metrics and log patterns (e.g., error rates, latency spikes, specific log messages).
- Dashboard Creation: Build comprehensive dashboards that combine metrics, logs, and traces for a holistic view.
- Cost Monitoring: Include observability tools' costs in your overall cloud budget, as they can add up.
Tradeoffs and Cost Considerations
Implementing advanced observability is not without its tradeoffs. The primary concern is often cost. Ingesting, storing, and analyzing large volumes of logs, metrics, and trace data can become expensive, especially at scale.
There's also an instrumentation overhead. Adding tracing and custom metrics slightly increases function execution time and memory usage. Careful selection of what to instrument and what level of detail to capture is crucial to balance visibility with performance and cost.
At Muhyo Tech, we always discuss these tradeoffs transparently with our clients. We design observability solutions that are comprehensive enough to provide critical insights but also mindful of operational costs and performance implications. It's about finding the right balance for each specific application's needs and budget.
Comparison: Observability Tools for Serverless
| Tool/Platform | Strengths | Considerations |
|---|---|---|
| AWS X-Ray | Deep integration with AWS services, automatic instrumentation for many services, visual service maps. | AWS-specific, can be costly for high volume, less flexible for multi-cloud. |
| Datadog | Comprehensive full-stack monitoring, excellent dashboards, APM features, good for hybrid/multi-cloud. | Higher cost, can be complex to set up initially, agent-based often. |
| New Relic | Strong APM capabilities, good distributed tracing, broad language support, user experience monitoring. | Proprietary data format, can be expensive, learning curve for full features. |
| Grafana (Loki/Prometheus/Tempo) | Open source, highly customizable, cost-effective if self-hosted, powerful dashboards. | Requires significant operational overhead for self-hosting, steeper learning curve. |
Business Value: Why Proactive Observability Matters
Investing in robust serverless observability translates directly into significant business value:
- Reduced Mean Time To Resolution (MTTR): Faster issue identification and resolution means less downtime and fewer unhappy users.
- Improved Application Reliability: Proactive detection of anomalies allows you to address issues before they become outages.
- Optimized Serverless Costs: By identifying cold starts, inefficient function invocations, or overly long execution times, you can fine-tune your serverless configurations and reduce cloud spend. This directly contributes to website speed optimization by eliminating hidden inefficiencies.
- Enhanced Developer Productivity: Engineers spend less time debugging and more time building new features, leading to faster development cycles.
- Better User Experience: A more reliable and performant application directly improves customer satisfaction and trust.
Common Mistakes to Avoid
Even with the best intentions, several pitfalls can undermine serverless observability efforts:
- Logging Everything, Analyzing Nothing: Generating excessive, unstructured logs without a clear purpose creates noise and incurs unnecessary costs. Focus on structured, contextual logging.
- Ignoring Distributed Tracing: Relying solely on logs and metrics will leave blind spots in understanding complex, multi-service interactions.
- Lack of Standardization: Inconsistent logging formats, metric naming conventions, or trace propagation across teams leads to fragmented data and difficult correlation.
- Alerting Fatigue: Setting too many alerts, or alerts on non-actionable metrics, can lead to engineers ignoring critical warnings. Focus on actionable alerts that indicate a real problem.
- Neglecting Cost Monitoring: Observability tools can become a significant part of your cloud bill. Regularly review and optimize data retention policies and ingestion rates.
Frequently Asked Questions
How can I set up proactive monitoring for serverless applications?
Proactive monitoring involves implementing structured logging, custom application-specific metrics, and distributed tracing. Use unique request IDs to correlate data across these sources and configure alerts based on anomalies in your combined telemetry data, rather than just basic errors.
What tools are best for serverless observability and proactive issue resolution?
For cloud-native serverless, AWS X-Ray, Azure Monitor, and Google Cloud Trace offer good integration. For a multi-cloud or hybrid approach, tools like Datadog, New Relic, and the open-source Grafana stack (Loki, Prometheus, Tempo) are excellent choices, often leveraging OpenTelemetry for instrumentation.
How does distributed tracing contribute to proactive serverless issue detection?
Distributed tracing provides an end-to-end view of a request's journey across all serverless functions and services. By visualizing the flow and timing of each operation, you can proactively identify latency bottlenecks, unexpected service dependencies, or specific functions that frequently fail, even before they cause a full outage.
Conclusion
Serverless architectures offer immense potential, but realizing that potential depends heavily on your ability to understand and troubleshoot your systems effectively. Moving beyond basic logs and metrics to embrace structured logging, custom metrics, and, most importantly, distributed tracing, is no longer optional.
It's an essential investment in reliability, performance, and developer sanity. By designing for proactive observability from the outset, you build systems that are not just fast and scalable, but also resilient and maintainable, ready to deliver consistent value to your users.