


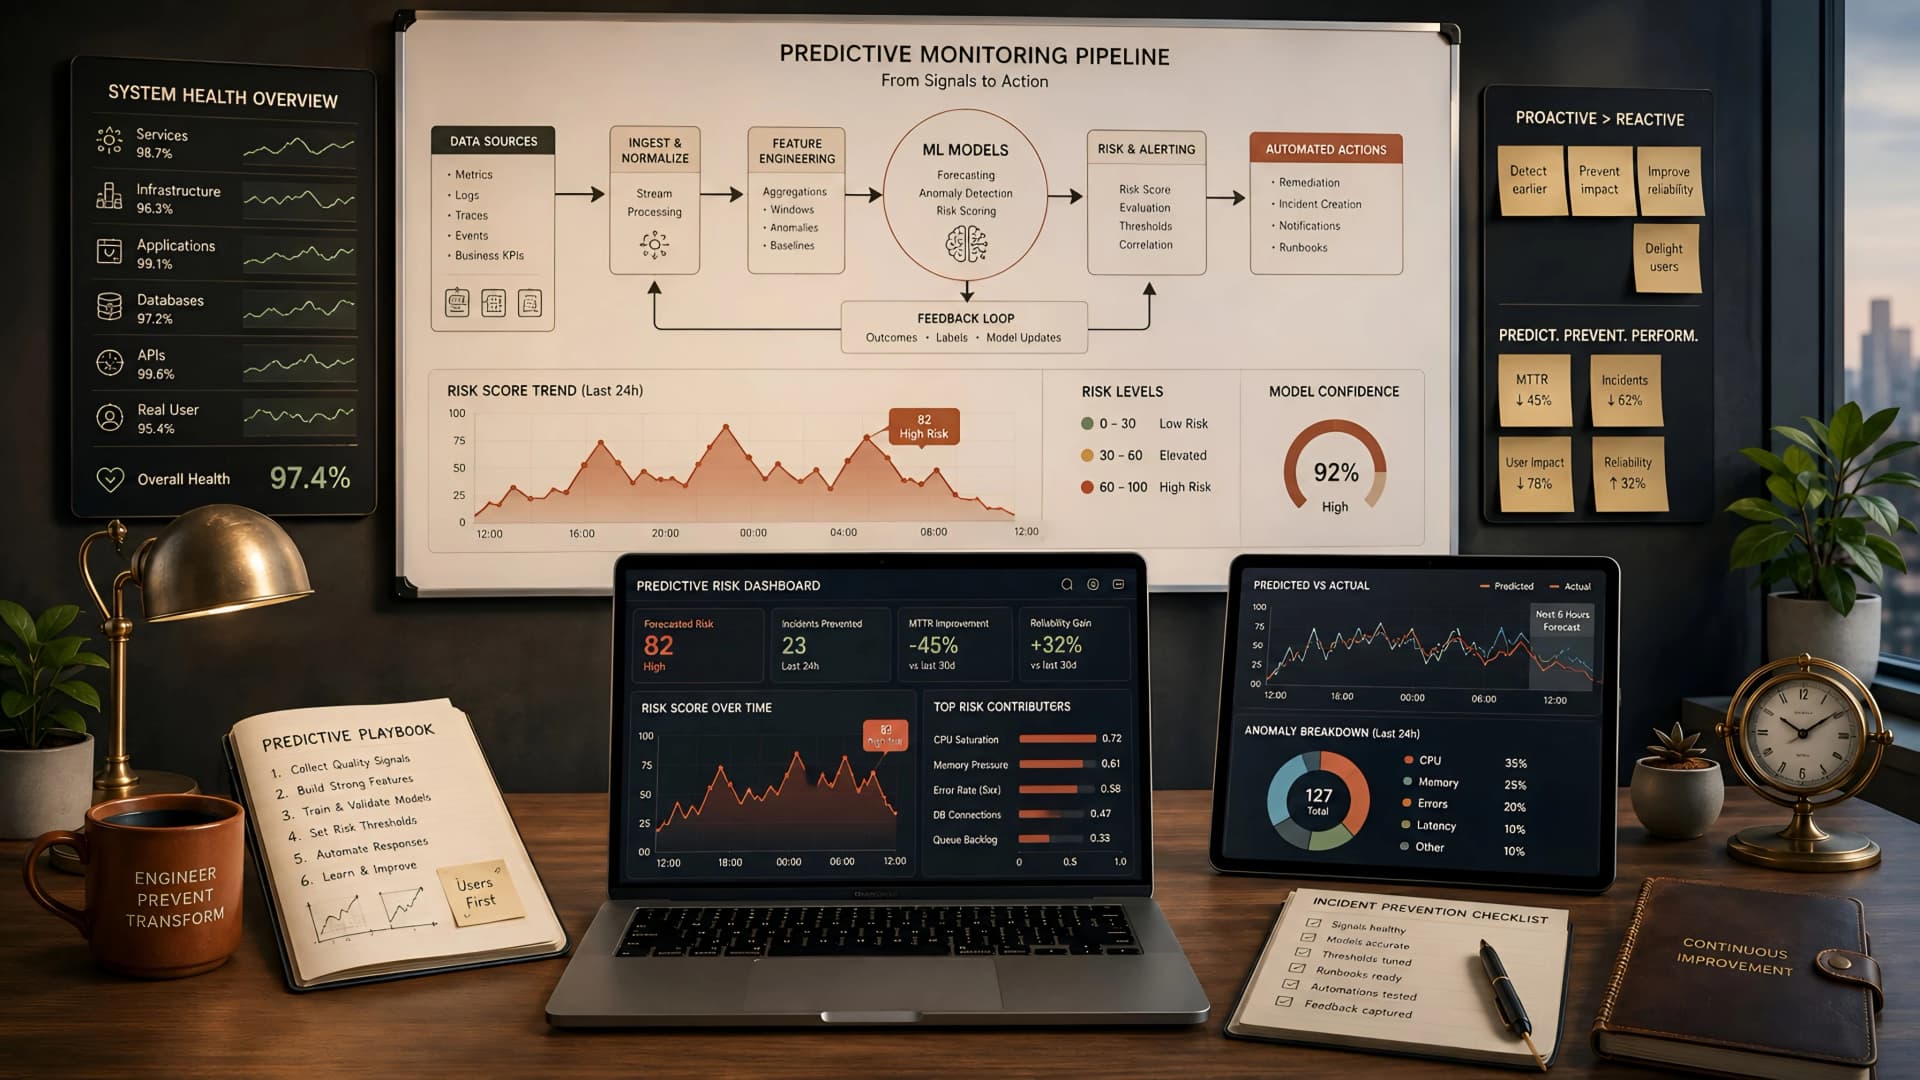
In the world of production systems, traditional monitoring and observability tools are essential. They tell us what’s happening right now, or what just happened. This reactive posture, however, often means we’re already in the midst of an incident when the alerts fire.
The real challenge, and the path to true system resilience, lies in anticipating problems before they escalate. This shift from reactive firefighting to proactive incident prevention is the core promise of predictive monitoring.
The Pain of Reactive Operations
Every engineering team has experienced the late-night alert, the frantic scramble to diagnose a sudden outage, or the subtle performance degradation that only users report. These moments are costly, not just in terms of revenue, but in engineering morale and user trust.
Traditional observability, while powerful, often presents data in isolation. Metrics show CPU spikes, logs detail errors, and traces pinpoint latency, but connecting these disparate signals to foresee a future failure is a human-intensive, often delayed process.
Why Reactive Isn't Enough Anymore
Modern distributed systems are too complex for humans to manually correlate every signal in real-time. The sheer volume of data makes it impossible to spot emerging patterns without assistance.
We need systems that can learn from the past, understand normal behavior, and flag deviations that indicate an impending problem. This is where predictive monitoring shines, transforming raw data into actionable foresight.
What is Predictive Monitoring?
Predictive monitoring is an advanced form of system surveillance that uses historical data, statistical analysis, and machine learning techniques to identify anomalies and forecast potential failures. Instead of merely reporting current status, it aims to predict future states.
It moves beyond simple threshold alerting, which often triggers too late or too frequently with false positives. The goal is to provide early warnings, giving engineering teams a crucial window to intervene before a critical incident occurs.
Core Components of Predictive Monitoring
At its heart, predictive monitoring relies on several key elements working in concert:
- Data Collection: Aggregating comprehensive metrics, logs, and traces from all layers of the application and infrastructure.
- Historical Data Analysis: Building a baseline understanding of normal system behavior over time.
- Anomaly Detection: Identifying deviations from established baselines that are statistically significant.
- Correlation: Linking seemingly unrelated anomalies across different data sources to form a clearer picture of a potential problem.
- Forecasting: Using statistical models or machine learning to predict future resource consumption, error rates, or other critical metrics.
- Alerting & Remediation: Triggering intelligent alerts and, in some cases, automated remediation actions based on predictions.
Implementing Predictive Monitoring: A Practical Approach
Building a robust predictive monitoring system requires thoughtful architecture and iterative refinement. It's not a one-time setup but an ongoing process of learning and adaptation.
At Muhyo Tech, we approach this by integrating these capabilities into our MERN stack and full-stack web application development workflows, ensuring reliability is baked in from the start.
1. Comprehensive Data Ingestion
The foundation of any predictive system is data. You need to collect everything relevant: application metrics (response times, error rates, throughput), infrastructure metrics (CPU, memory, disk I/O, network latency), logs (application, server, security), and distributed traces.
Standardize your data formats where possible. Use tools like Prometheus for metrics, Fluentd/Logstash for logs, and OpenTelemetry for traces to ensure consistent collection across heterogeneous environments.
2. Establishing Baselines and Anomaly Detection
Once data is flowing, the next step is to understand what 'normal' looks like. This involves analyzing historical data over weeks or months to establish dynamic baselines for each metric.
Simple thresholds are static. Predictive monitoring employs dynamic baselines that account for daily, weekly, and seasonal patterns. Anomaly detection algorithms (e.g., statistical methods, machine learning models like Isolation Forest or ARIMA for time series) then flag deviations from these dynamic baselines.
3. Correlation and Contextualization
A single anomaly is rarely enough to predict an outage. The real power comes from correlating multiple anomalies across different data types and services. A spike in database CPU, coupled with an increase in HTTP 500 errors from a specific microservice and a corresponding drop in transaction throughput, paints a much clearer picture.
This correlation helps reduce alert fatigue and provides actionable context. Tools that support distributed tracing are invaluable here, as they visually link operations across services.
4. Forecasting and Proactive Alerting
Forecasting involves using time-series analysis or machine learning to predict future values of key metrics. For example, predicting when a disk will run out of space, when a database connection pool will be exhausted, or when a queue will overflow based on current trends.
Proactive alerts are then triggered when a forecasted metric crosses a critical threshold within a defined future window (e.g., 'disk predicted to be full in 4 hours'). This gives engineers time to act before an actual incident.
Moving from a 'what happened?' mindset to a 'what's about to happen?' mindset fundamentally changes how engineering teams operate. It shifts stress from reactive scrambling to deliberate, planned interventions.
Predictive Monitoring Architecture Checklist
Implementing predictive monitoring involves several layers and components. Here's a checklist we often use:
- Data Ingestion Layer:
- ✓ Centralized log aggregation (e.g., ELK Stack, Grafana Loki, Splunk)
- ✓ Metrics collection agent (e.g., Prometheus Node Exporter, Telegraf)
- ✓ Distributed tracing instrumentation (e.g., OpenTelemetry, Jaeger)
- ✓ API gateways and service meshes for request/response logging
- Data Storage & Processing:
- ✓ Time-series database (e.g., Prometheus, InfluxDB)
- ✓ Data lake/warehouse for long-term historical data (e.g., S3, Google Cloud Storage)
- ✓ Stream processing for real-time analysis (e.g., Kafka Streams, Flink)
- Analytics & Intelligence Layer:
- ✓ Anomaly detection algorithms (statistical, ML-based)
- ✓ Correlation engines for linking disparate events
- ✓ Forecasting models (e.g., ARIMA, Prophet, custom ML models)
- ✓ Root cause analysis (RCA) automation features
- Visualization & Alerting:
- ✓ Customizable dashboards (e.g., Grafana, Kibana)
- ✓ Alerting engine with flexible notification channels (e.g., PagerDuty, Slack, Email)
- ✓ Automated incident response integrations (e.g., webhooks to runbooks)
- Infrastructure & Operations:
- ✓ Container orchestration for scalable deployment (e.g., Kubernetes)
- ✓ CI/CD pipelines for automated deployment of monitoring agents and models
- ✓ Version control for monitoring configurations
- ✓ Cost management for data storage and processing resources
Tools and Technologies for Predictive Monitoring
The ecosystem of monitoring tools is vast, but several stand out for their capabilities in predictive analysis:
| Tool Category | Examples | Predictive Capabilities |
|---|---|---|
| Observability Platforms | Datadog, New Relic, Dynatrace, Splunk | Built-in anomaly detection, AI-driven correlation, forecasting features, unified dashboards. |
| Time-Series Databases & Monitoring | Prometheus, InfluxDB, Grafana | Powerful querying for historical data, visual pattern identification, some anomaly detection plugins. |
| Log Management | Elastic Stack (ELK), Grafana Loki | Pattern recognition in logs, anomaly detection on log volumes/error rates, log correlation. |
| Machine Learning Frameworks | TensorFlow, PyTorch, Scikit-learn | Custom model development for advanced anomaly detection and forecasting, often integrated with data pipelines. |
| Cloud Provider Services | AWS CloudWatch Anomaly Detection, Google Cloud Operations (formerly Stackdriver), Azure Monitor | Managed services for metrics, logs, tracing with integrated anomaly detection and forecasting. |
Pros and Cons of Commercial vs. Open Source
Commercial Platforms (e.g., Datadog, New Relic):
- Pros: Unified platform, out-of-the-box ML/AI features, excellent UX, strong support.
- Cons: High cost, vendor lock-in, less customization flexibility for niche models.
Open Source Solutions (e.g., Prometheus, Grafana, ELK Stack):
- Pros: Cost-effective (no licensing fees), highly customizable, strong community support, full control over data.
- Cons: Requires significant engineering effort for setup, maintenance, and custom ML integration; can lack integrated 'AI' features without custom development.
At Muhyo Tech, we often blend these approaches. For smaller projects, a well-configured open-source stack can be incredibly powerful. For larger, more complex systems, the integrated intelligence of a commercial platform often justifies the investment, especially when time-to-market and operational efficiency are paramount.
Business Value: Why Predictive Monitoring Matters
The investment in predictive monitoring yields significant returns beyond just technical elegance. It directly impacts the bottom line and operational efficiency.
Reduced Downtime and Improved Reliability
By preventing incidents, systems remain available and performant. This translates directly to sustained revenue for e-commerce, continuous service for SaaS, and uninterrupted operations for business applications.
Users experience fewer disruptions, building greater trust in your platform.
Lower Operational Costs
Less time spent firefighting means engineering teams can focus on innovation and feature development. The cost of an incident (lost revenue, customer support, engineering hours) is far greater than the cost of prevention.
Proactive scaling and resource management based on forecasts can also optimize infrastructure spend.
Enhanced User Experience and Brand Reputation
A reliable system is a delightful system. Users expect seamless experiences, and predictive monitoring helps deliver that consistency. Fewer outages and performance hiccups strengthen your brand's reputation for quality and reliability.
This is especially critical for client-facing applications developed with frameworks like the MERN stack, where user perception is everything.
Better Decision-Making
The insights gained from predictive monitoring extend beyond incident prevention. Understanding trends and anticipating load patterns allows for more informed decisions on capacity planning, architectural changes, and feature rollouts.
It provides a clearer view of system health and potential future bottlenecks.
Trade-offs and Considerations
Predictive monitoring is not a silver bullet. It comes with its own set of challenges and trade-offs:
- Complexity: Implementing and maintaining these systems requires specialized skills in data engineering, machine learning, and DevOps.
- Cost: Storing and processing large volumes of data, especially for long periods, can be expensive. ML model training also consumes significant compute resources.
- False Positives/Negatives: No predictive model is perfect. There will be instances where an alert fires for a non-issue (false positive) or an issue occurs without a prior prediction (false negative). Iterative refinement is crucial.
- Data Quality: The accuracy of predictions heavily relies on the quality and completeness of the ingested data. 'Garbage in, garbage out' applies strongly here.
- Model Drift: System behavior changes over time due to new features, increased load, or architectural shifts. Predictive models need continuous retraining and adaptation to remain effective.
These challenges highlight the need for a pragmatic, iterative approach. Start simple, prove value, and then gradually expand the sophistication of your predictive capabilities.
Frequently Asked Questions
How does predictive monitoring differ from traditional monitoring?
Traditional monitoring is reactive; it tells you what's happening now or what just happened. Predictive monitoring is proactive, using historical data and ML to anticipate future problems before they impact users.
What data sources are essential for effective predictive monitoring?
You need a comprehensive collection of metrics (CPU, memory, response times), logs (application errors, system events), and distributed traces. The more diverse and granular your data, the better your predictions.
Is machine learning always necessary for predictive monitoring?
Not always, but it significantly enhances capabilities. Simple statistical methods can establish baselines and detect anomalies. However, for complex patterns, correlation across disparate data, and accurate forecasting, machine learning models are often indispensable.
What are the biggest challenges when implementing predictive monitoring?
Key challenges include managing data volume and quality, the complexity of integrating and maintaining ML models, the potential for false positives/negatives, and the ongoing need to retrain models as system behavior evolves.
The Future is Proactive
Shifting from reactive incident response to proactive prevention is a journey, not a destination. Predictive monitoring is a powerful tool in this journey, enabling engineering teams to build more resilient systems and deliver superior user experiences.
It's about empowering engineers with foresight, reducing the stress of production incidents, and ultimately, building more stable and trustworthy digital products. This is the standard of reliability we strive for at Muhyo Tech, ensuring the applications we build are not just functional, but enduringly robust.